The Print menu from the Transaction Audit gives you the option to produce standard graphs/charts in Excel. This is achieved by the following:
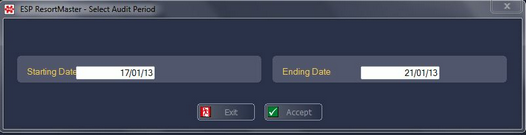
Select Transaction Audit and the following window will appear.
Enter the starting and ending dates for the audit. Now select F3 Accept and the Transaction Audit Selection window will appear.
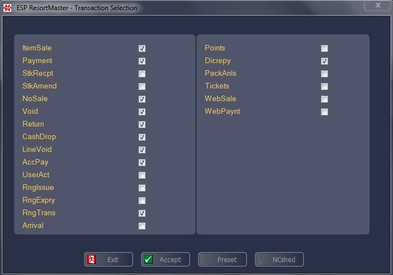
This is where the queries for the audit may be set; date, time, operator(s), station number(s) etc. Once the required parameters have been set, select F3 Accept and a new window will appear.
From this menu the user may select the information to be viewed. Any box that is ticked will be included in the results. Once a selection has been made and F3 Accept is chosen, the results will be shown as follows.
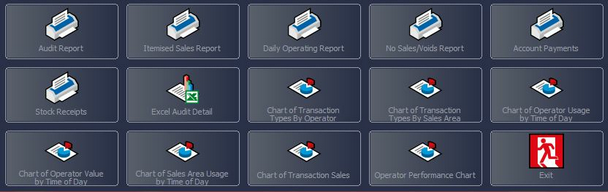
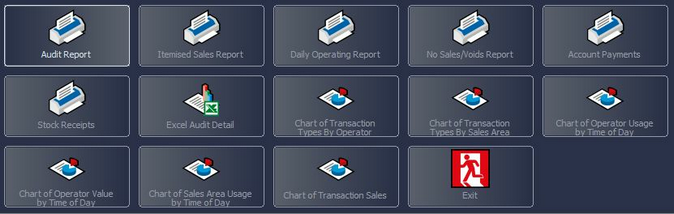
From this screen you now have the option to select F8 Print. You will then see the following menu.
There are 5 Charts/Graphs available:
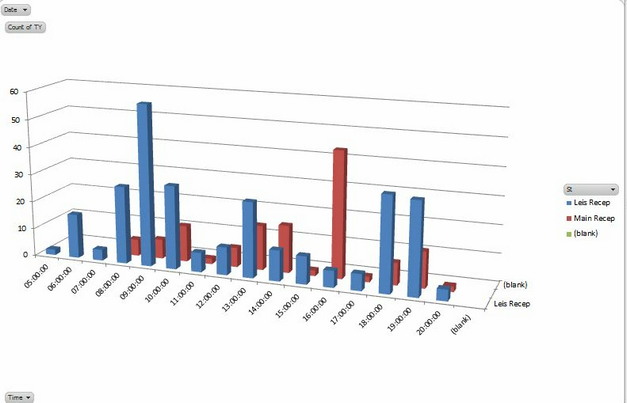
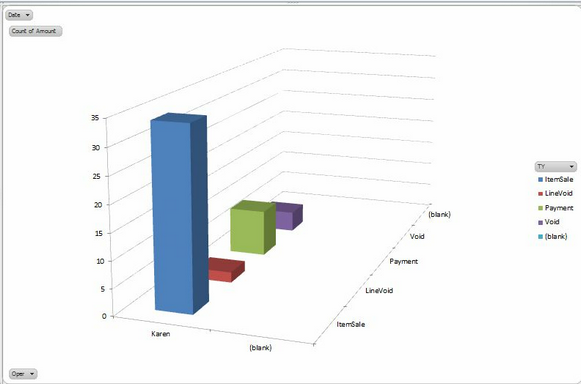
When you select one of the chart options, a new file will open in Excel and the chart will be displayed as below.
Once the chart has been created in Excel, you are then able to use the Standard Excel Functionality to change the style of the chart, e.g. to a Pie Chart, Line Graph etc.
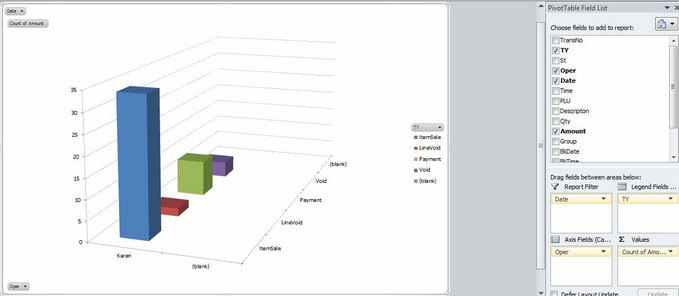
In addition there are specific filters on the graph which you can use to change the amount of data which is displayed, e.g. to view certain operators, sales areas, transaction types, etc.
These filters are operated by selecting the drop-down arrows on the graph, as shown below.
|
||||||||||